Monitoring
Due to the large number of interacting components in Lobster, troubleshooting problems can be very challenging. A hiccup in the performance of one element can have a cascading impact on the rest of the system. For example, if the performance of a data cache is impeded for some reason, this will be reflected as low bandwidth in data transfers, resulting in low CPU efficiency for individual tasks, and then eventually in extended run times. To address this problem, we have implemented a comprehensive monitoring technique that covers almost every aspect of the system and the infrastructure. This enables us to disentangle the root cause of many runtime performance problems.
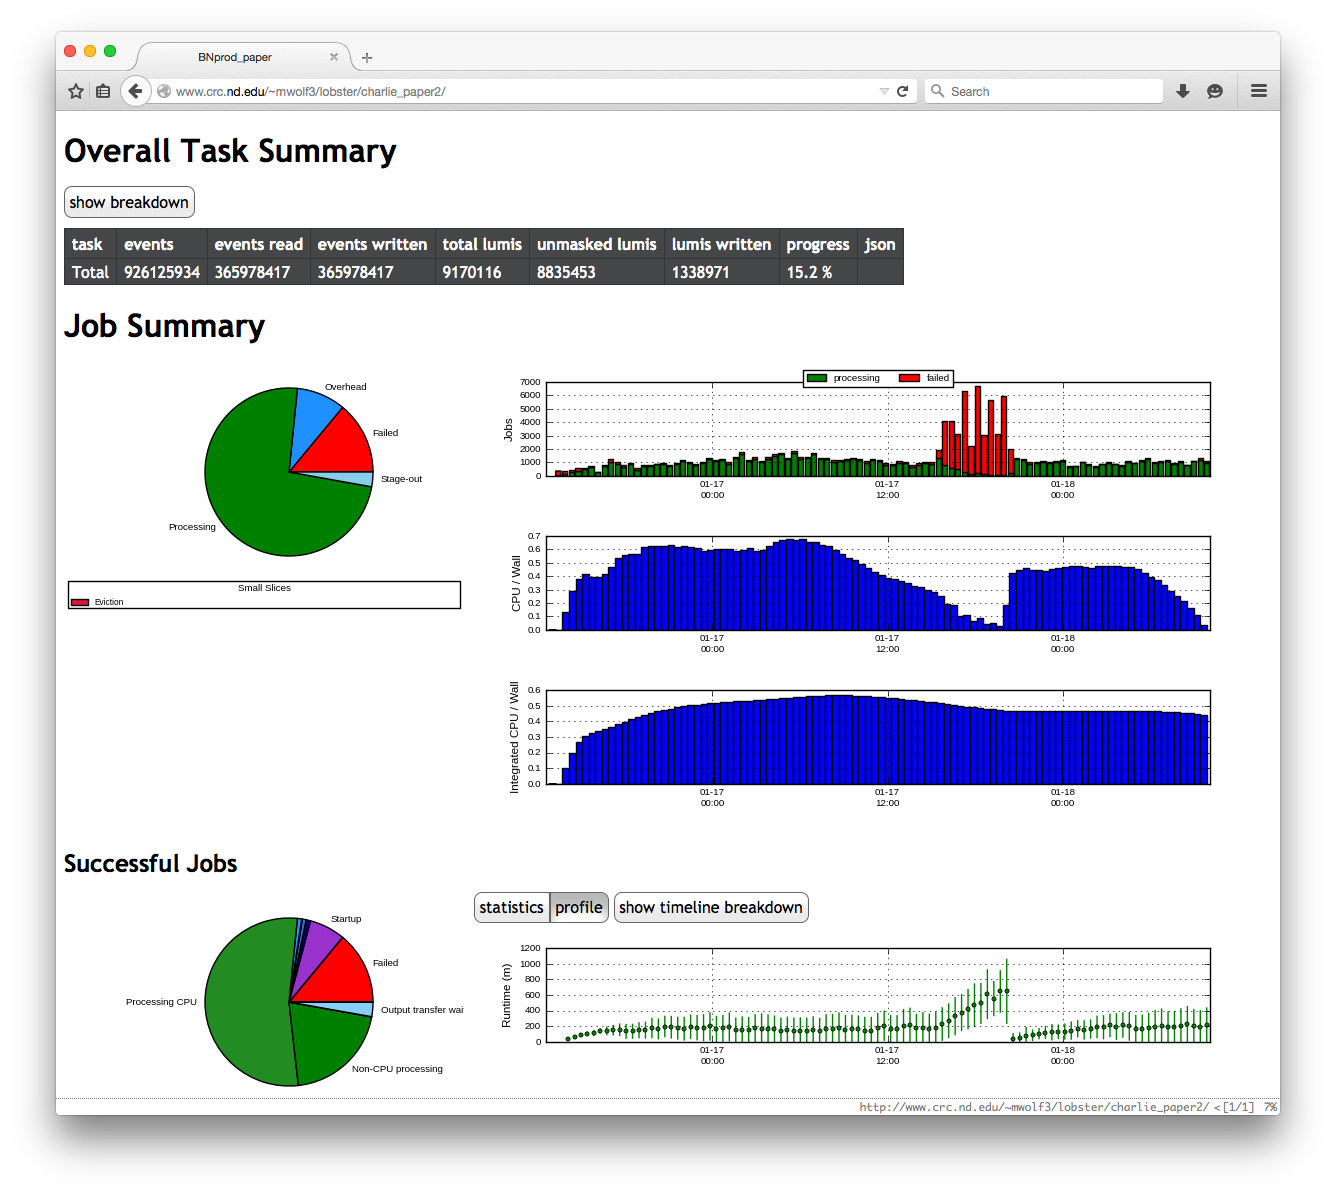
The timeline of a task is broken into small steps, and timing information about every step of every task stored in a database. Periodically, the monitoring overview is updated with refreshed historical and statistical views of all essential components within Lobster.
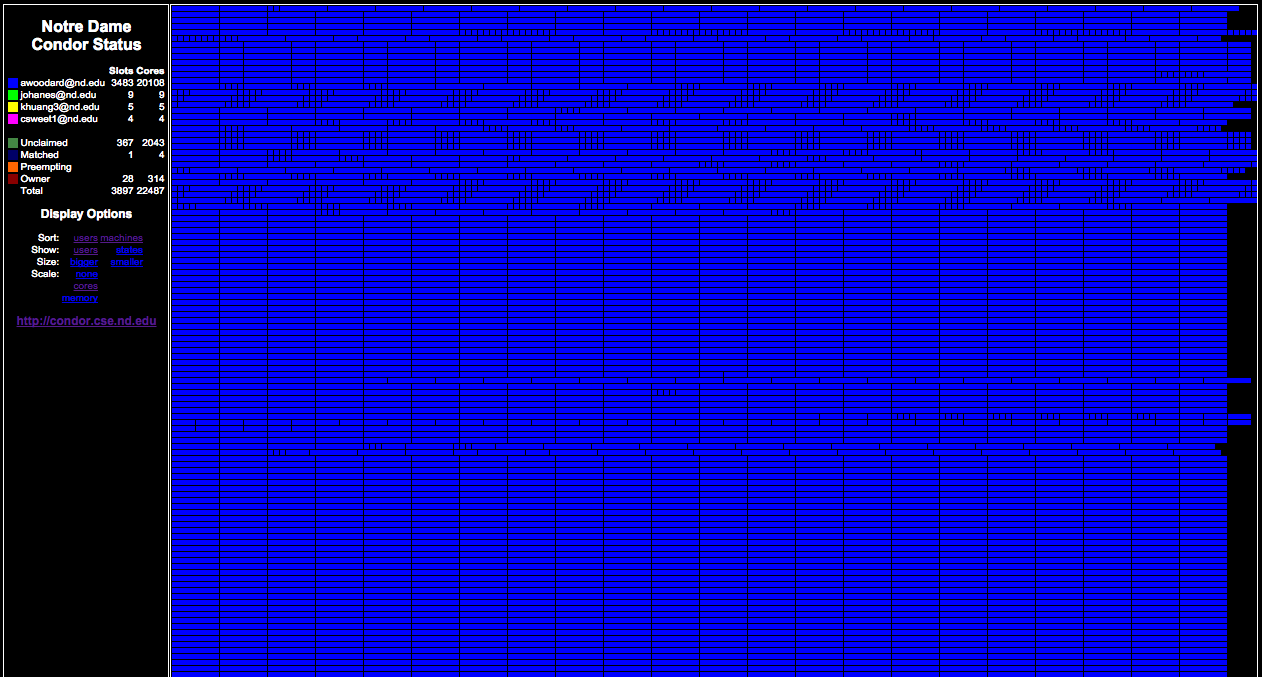
We were very fortunate to have been granted a brief testing slot immediately following the most recent bi-annual maintenance period at the CRC, before the normal condor job load resumed. This allowed us to perform a large-scale run, which we used to learn about what performance bottlenecks await us as we increase in scale. Here is the condor matrix display during the test: